How to Explain Decision Tree Prediction
Decision Tree is a white box model because it is intuitive to interpret why the model gives output or prediction from the inputs. It is also a Symbolic AI method in which it provides “symbolic” (human-readable) representations of logic or rule.
Using Iris flower dataset, we build a decision tree classifier to classify input of 4 features, sepal length (cm), sepal width (cm), petal length (cm), and petal width (cm) into 3 classes of Iris flower species consisting of setosa, versicolor and virginica.
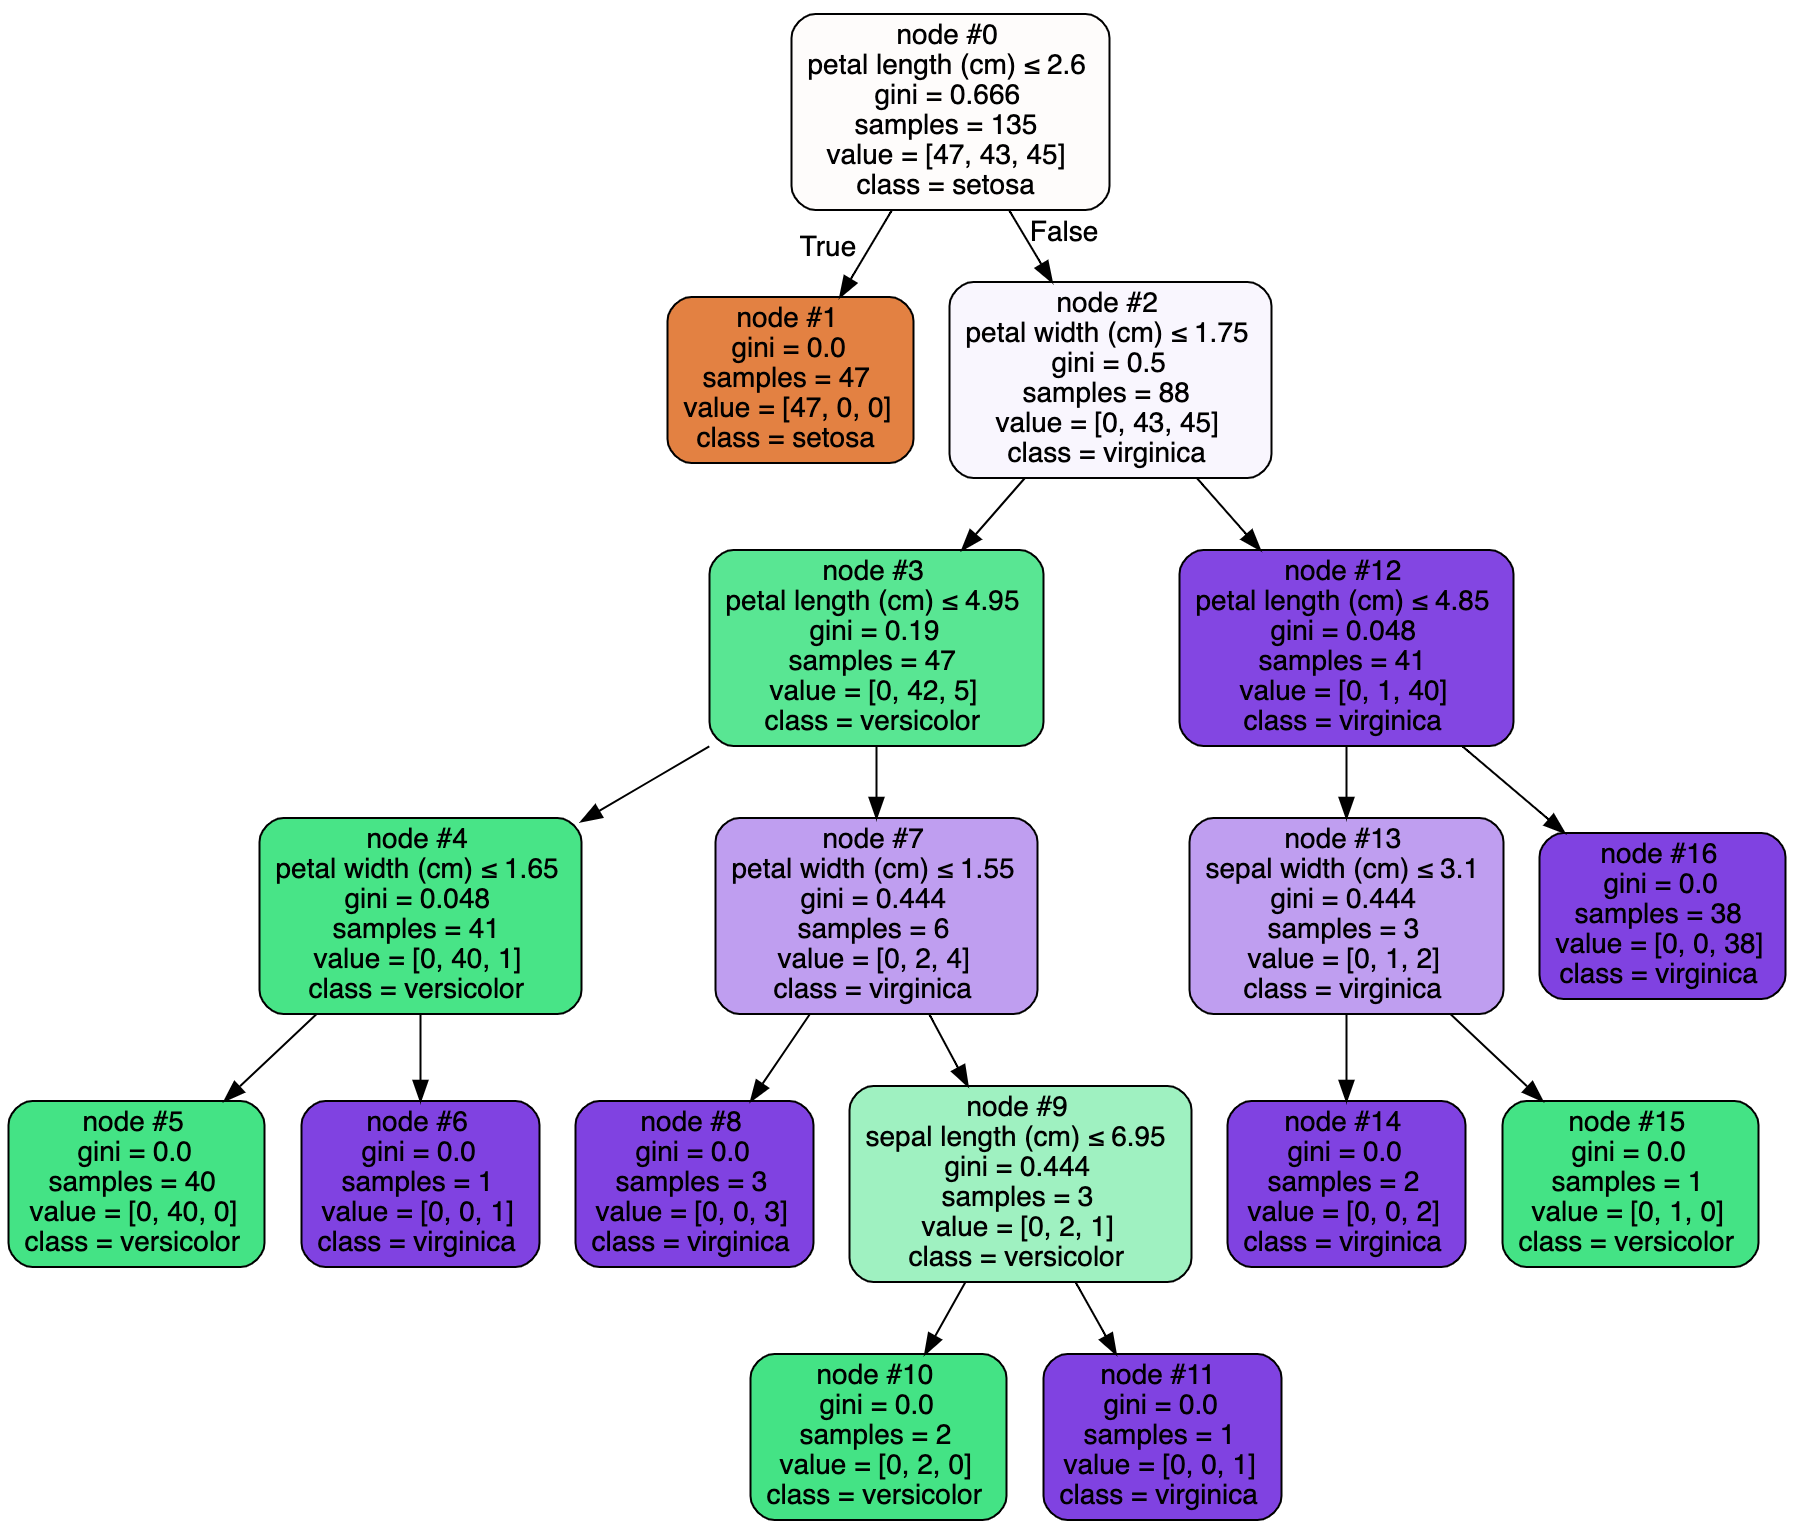
Assuming the trained decision tree classifier looks like below.
Let’s pick 1 input from test dataset for example,
| sepal length (cm) | sepal width (cm) | petal length (cm) | and petal width (cm) |
|---|---|---|---|
| 6.2 | 3.4 | 5.4 | 2.3 |
The model predicts the input to be virginica.
How do we explain the prediction? Why is it classified as virginica?
Since there are not many features, we can manually traverse through the decision tree model figure above to explain the prediction.
This is not scalable once we have many features to look at. Fortunately, we can programmatically explain the prediction.
The easiest way is to just display the decision path.
1 | decision_path = tree_clf.decision_path(selected_input) |
The second element of each tuple above represents the node ID traversed to reach the prediction result i.e. node #0 -> node #2 -> node #12 -> node #16.
To explain in more detail, we can dig deeper and compare each rule and input value side by side.
1 | level_length = len(decision_path.indices) |
In node #0, input value of 5.4 cm petal length results in false decision for the rule petal length (cm) <= 2.599999964237213, which leads to node #2.
In node #2, input value of 2.3 cm petal width results in false decision for the rule petal width (cm) <= 1.75, which leads to node #12.
In node #12, input value of 5.4 cm petal length results in false decision for the rule petal length (cm) <= 4.8500001430511475, which leads to node #16.
In node #16, there is no rule or decision criteria, it is the last node that gives the prediction result, virginica.
The notebook below demonstrates the implementation steps. Although the decision tree model may not remain the same, the prediction can always be explained.
References
- https://scikit-learn.org/stable/modules/generated/sklearn.tree.DecisionTreeClassifier.html#sklearn.tree.DecisionTreeClassifier.decision_path
- https://github.com/scikit-learn/scikit-learn/blob/master/sklearn/tree/export.py. See
node_to_strmethod. - https://en.wikipedia.org/wiki/Symbolic_artificial_intelligence